
Create your own USB gadget with GadgetFS
Do It Yourself, make your own objects, this is in vogue. Since the first version RaspberryPI, we can see a lot of little boards with GPIO connections that handles basic sensors/connectors. Even if some prefer to use wireless communications to communicate with these little devices, USB is still there !
Today I'll show an example of a basic raw bulk USB communication. We could setup our device with the serial line gadget (/dev/ttyGS0), but if you need performance or you want to handle specific USB feature, it's interesting to use raw transfers. Plus, all of this is done in userspace thanks to GadgetFS.
I waste a lot of time due to a buggy USB driver (dwc2), but, finally, the right code is simple.
1. USB keywords
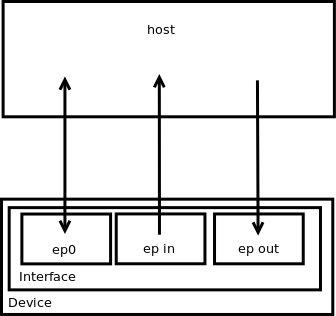
All technical details about USB can be found within usb.org or linux-usb.org, it's quite heavy. Basically, USB communication use a master/slave schema : host side (mainly a PC) sends requests to device side (device). Device never asks questions, it only replies.
Configuration of USB port can be static (host or device) or dynamic. This is the case for DRD (Dual Role Device) configurations, which was previously called OTG (On The Go : who is the first to talk ?).
On the device, we have endpoints grouped into interfaces. Each endpoint contains a hardware buffer (memory) to deal with requests. An endpoint is setup (hardcoded) to be in or out, meaning, it can do only "in" or "out" operation.
In addition to direction, the type of endpoint is important (it's assigned during endpoint configuration). It can be :
- control for configuration/control requests
- bulk for bulk transfers
- isochronous for periodic transfers with a reserved bandwidth
- int for transfers by interruption
A special endpoint called ep0 (the first one) is always present. It's an in and out endpoint with control attribute. It allows to read/write configuration of other endpoints.
All these information are described in descriptors. You can look at them with
lsusb -v
The low level command sent to controller is called an URB (USB Request Block).
A picture to sum up :
2. Enable and mount GadgetFS
First thing to do is to enable GadgetFS in the kernel you're running (if it's not already the case).
Run make menuconfig [ARCH=XXX] in the kernel build directory. Then, enable
Device Drivers -> USB support -> USB Gadget Support -> USB Gadget Drivers -> Gadget Filesystem
In the same section (or in the section above depending on your controller), select the right Peripheral Controller.
You can now rebuild your Linux kernel.
Once booted, mount GadgetFS (in /dev for example)
mkdir /dev/gadget
mount -t gadgetfs gadgetfs /dev/gadget
3. Device side
There is a reference code that can be found in linux-usb.org which manage everything and can use aio for asynchronous requests management. Mine is simpler, full code link can be found in Conclusion part. I'll explain each parts in details.
Let's start. Do includes. usbtring.c is copied from linux-usb.org (strings sent back to host must be encoded in UTF-16). Most of structures and defines are referenced in ch9.h (which corresponds to chapter 9 of the USB norm) and gadgetfs.h
#include <sys/ioctl.h>
#include <sys/types.h>
#include <sys/stat.h>
#include <sys/select.h>

#include <linux/types.h>
#include <linux/usb/ch9.h>
#include <linux/usb/gadgetfs.h>

#include <fcntl.h>
#include <stdio.h>
#include <unistd.h>
#include <stdint.h>
#include <string.h>
#include <pthread.h>

#include <errno.h>

#include "usbstring.c"
Then, defines
#define FETCH(_var_)                            \
    memcpy(cp, &_var_, _var_.bLength);          \
    cp += _var_.bLength;

#define CONFIG_VALUE 2

// Specific to controller
#define USB_DEV "/dev/gadget/dwc2"
#define USB_EPIN "/dev/gadget/ep1in"
#define USB_EPOUT "/dev/gadget/ep2out"

enum {
    STRINGID_MANUFACTURER = 1,
    STRINGID_PRODUCT,
    STRINGID_SERIAL,
    STRINGID_CONFIG_HS,
    STRINGID_CONFIG_LS,
    STRINGID_INTERFACE,
    STRINGID_MAX
};
Config value is the number of endpoints. After that, we have paths relative to GadgetFS. When mounted, there is only USB_DEV, endpoints appears after the first configuration (ep0). Name of endpoints is dependent of the driver implementation.
Structures and static variables :
struct io_thread_args {
    unsigned stop;
    int fd_in, fd_out;
};

static struct io_thread_args thread_args;

static struct usb_string stringtab [] = {
    { STRINGID_MANUFACTURER, "MyOwnGadget", },
    { STRINGID_PRODUCT,      "Custom gadget", },
    { STRINGID_SERIAL,       "0001", },
    { STRINGID_CONFIG_HS,    "High speed configuration", },
    { STRINGID_CONFIG_LS,    "Low speed configuration", },
    { STRINGID_INTERFACE,    "Custom interface", },
    { STRINGID_MAX, NULL},
};

static struct usb_gadget_strings strings = {
    .language = 0x0409, /* en-us */
    .strings = stringtab,
};

static struct usb_endpoint_descriptor ep_descriptor_in;
static struct usb_endpoint_descriptor ep_descriptor_out;
The main thing here is the description of strings inside stringtag that will be parsed by usbstring functions.
int main()
{
    int fd=-1, ret, err=-1;
    uint32_t send_size;
    struct usb_config_descriptor config;
    struct usb_config_descriptor config_hs;
    struct usb_device_descriptor device_descriptor;
    struct usb_interface_descriptor if_descriptor;
    uint8_t init_config[2048];
    uint8_t* cp;

    fd = open(USB_DEV, O_RDWR|O_SYNC);

    if (fd <= 0)
    {
        printf("Unable to open %s (%m)\n", USB_DEV);
        return 1;
    }

    *(uint32_t*)init_config = 0;
    cp = &init_config[4];

    device_descriptor.bLength = USB_DT_DEVICE_SIZE;
    device_descriptor.bDescriptorType = USB_DT_DEVICE;
    device_descriptor.bDeviceClass = USB_CLASS_COMM;
    device_descriptor.bDeviceSubClass = 0;
    device_descriptor.bDeviceProtocol = 0;
    //device_descriptor.bMaxPacketSize0 = 255; Set by driver
    device_descriptor.idVendor = 0xAA; // My own id
    device_descriptor.idProduct = 0xBB; // My own id
    device_descriptor.bcdDevice = 0x0200; // Version
    // Strings
    device_descriptor.iManufacturer = STRINGID_MANUFACTURER;
    device_descriptor.iProduct = STRINGID_PRODUCT;
    device_descriptor.iSerialNumber = STRINGID_SERIAL;
    device_descriptor.bNumConfigurations = 1; // Only one configuration

    ep_descriptor_in.bLength = USB_DT_ENDPOINT_SIZE;
    ep_descriptor_in.bDescriptorType = USB_DT_ENDPOINT;
    ep_descriptor_in.bEndpointAddress = USB_DIR_IN | 1;
    ep_descriptor_in.bmAttributes = USB_ENDPOINT_XFER_BULK;
    ep_descriptor_in.wMaxPacketSize = 512; // HS size

    ep_descriptor_out.bLength = USB_DT_ENDPOINT_SIZE;
    ep_descriptor_out.bDescriptorType = USB_DT_ENDPOINT;
    ep_descriptor_out.bEndpointAddress = USB_DIR_OUT | 2;
    ep_descriptor_out.bmAttributes = USB_ENDPOINT_XFER_BULK;
    ep_descriptor_out.wMaxPacketSize = 512; // HS size

    if_descriptor.bLength = sizeof(if_descriptor);
    if_descriptor.bDescriptorType = USB_DT_INTERFACE;
    if_descriptor.bInterfaceNumber = 0;
    if_descriptor.bAlternateSetting = 0;
    if_descriptor.bNumEndpoints = 2;
    if_descriptor.bInterfaceClass = USB_CLASS_COMM;
    if_descriptor.bInterfaceSubClass = 0;
    if_descriptor.bInterfaceProtocol = 0;
    if_descriptor.iInterface = STRINGID_INTERFACE;

    config_hs.bLength = sizeof(config_hs);
    config_hs.bDescriptorType = USB_DT_CONFIG;
    config_hs.wTotalLength = config_hs.bLength +
        if_descriptor.bLength + ep_descriptor_in.bLength + ep_descriptor_out.bLength;
    config_hs.bNumInterfaces = 1;
    config_hs.bConfigurationValue = CONFIG_VALUE;
    config_hs.iConfiguration = STRINGID_CONFIG_HS;
    config_hs.bmAttributes = USB_CONFIG_ATT_ONE | USB_CONFIG_ATT_SELFPOWER;
    config_hs.bMaxPower = 1;

    config.bLength = sizeof(config);
    config.bDescriptorType = USB_DT_CONFIG;
    config.wTotalLength = config.bLength +
        if_descriptor.bLength + ep_descriptor_in.bLength + ep_descriptor_out.bLength;
    config.bNumInterfaces = 1;
    config.bConfigurationValue = CONFIG_VALUE;
    config.iConfiguration = STRINGID_CONFIG_LS;
    config.bmAttributes = USB_CONFIG_ATT_ONE | USB_CONFIG_ATT_SELFPOWER;
    config.bMaxPower = 1;

    FETCH(config);
    FETCH(if_descriptor);
    FETCH(ep_descriptor_in);
    FETCH(ep_descriptor_out);

    FETCH(config_hs);
    FETCH(if_descriptor);
    FETCH(ep_descriptor_in);
    FETCH(ep_descriptor_out);

    FETCH(device_descriptor);

    // Configure ep0
    send_size = (uint32_t)cp-(uint32_t)init_config;
    ret = write(fd, init_config, send_size);

    if (ret != send_size)
    {
        printf("Write error %d (%m)\n", ret);
        goto end;
    }

    printf("ep0 configured\n");

    handle_ep0(fd);

end:
    if (fd != -1) close(fd);

    return err;
}
The main function. We build the descriptors and send them to ep0. It's needed to send both low/full speed (USB 1) and high speed (USB 2) configurations. Here, they are quite the same. We have only one interface with two endpoints, one for in, and one for out. Descriptors are sent as a big char array that must starts by an uint32_t tag set to 0. All values are expressed in little endian.
ep0 function :
static void handle_ep0(int fd)
{
    int ret, nevents, i;
    fd_set read_set;
    struct usb_gadgetfs_event events[5];

    while (1)
    {
        FD_ZERO(&read_set);
        FD_SET(fd, &read_set);

        select(fd+1, &read_set, NULL, NULL, NULL);

        ret = read(fd, &events, sizeof(events));

        if (ret < 0)
        {
            printf("Read error %d (%m)\n", ret);
            goto end;
        }

        nevents = ret / sizeof(events[0]);

        printf("%d event(s)\n", nevents);

        for (i=0; i<nevents; i++)
        {
            switch (events[i].type)
            {
            case GADGETFS_CONNECT:
                printf("EP0 CONNECT\n");
                break;
            case GADGETFS_DISCONNECT:
                printf("EP0 DISCONNECT\n");
                break;
            case GADGETFS_SETUP:
                printf("EP0 SETUP\n");
                handle_setup_request(fd, &events[i].u.setup);
                break;
            case GADGETFS_NOP:
            case GADGETFS_SUSPEND:
                break;
            }
        }
    }

end:
    return;
}
This one receives events and handle them. The most important are setup requests, which are requests that kernel cannot full handle by itself (or notice userspace).
static void handle_setup_request(int fd, struct usb_ctrlrequest* setup)
{
    int status;
    uint8_t buffer[512];
    pthread_t thread;

    printf("Setup request %d\n", setup->bRequest);

    switch (setup->bRequest)
    {
    case USB_REQ_GET_DESCRIPTOR:
        if (setup->bRequestType != USB_DIR_IN)
            goto stall;
        switch (setup->wValue >> 8)
        {
            case USB_DT_STRING:
                printf("Get string id #%d (max length %d)\n", setup->wValue & 0xff,
                    setup->wLength);
                status = usb_gadget_get_string (&strings, setup->wValue & 0xff, buffer);
                // Error
                if (status < 0)
                {
                    printf("String not found !!\n");
                    break;
                }
                else
                {
                    printf("Found %d bytes\n", status);
                }
                write (fd, buffer, status);
                return;
        default:
            printf("Cannot return descriptor %d\n", (setup->wValue >> 8));
        }
        break;
    case USB_REQ_SET_CONFIGURATION:
        if (setup->bRequestType != USB_DIR_OUT)
        {
            printf("Bad dir\n");
            goto stall;
        }
        switch (setup->wValue) {
        case CONFIG_VALUE:
            printf("Set config value\n");
            if (!thread_args.stop)
            {
                thread_args.stop = 1;
                usleep(200000); // Wait for termination
            }
            if (thread_args.fd_in <= 0)
            {
                status = init_ep (&thread_args.fd_in, &thread_args.fd_out);
            }
            else
                status = 0;
            if (!status)
            {
                thread_args.stop = 0;
                pthread_create(&thread, NULL, io_thread, &thread_args);
            }
            break;
        case 0:
            printf("Disable threads\n");
            thread_args.stop = 1;
            break;
        default:
            printf("Unhandled configuration value %d\n", setup->wValue);
            break;
        }
        // Just ACK
        status = read (fd, &status, 0);
        return;
    case USB_REQ_GET_INTERFACE:
        printf("GET_INTERFACE\n");
        buffer[0] = 0;
        write (fd, buffer, 1);
        return;
    case USB_REQ_SET_INTERFACE:
        printf("SET_INTERFACE\n");
        ioctl (thread_args.fd_in, GADGETFS_CLEAR_HALT);
        ioctl (thread_args.fd_out, GADGETFS_CLEAR_HALT);
        // ACK
        status = read (fd, &status, 0);
        return;
    }

stall:
    printf("Stalled\n");
    // Error
    if (setup->bRequestType & USB_DIR_IN)
        read (fd, &status, 0);
    else
        write (fd, &status, 0);
}
A bad response within this function can stall the endpoint. Two principle functions are to send back strings (not managed by driver) and starts/stop io_thread().
The init_ep() function is pretty simple. It justs sends endpoint descriptors (in low/full and high speed configuration). Like ep0, it must starts with an uint32_t tag of value 1 :
static int init_ep(int* fd_in, int* fd_out)
{
    uint8_t init_config[2048];
    uint8_t* cp;
    int ret = -1;
    uint32_t send_size;

    // Configure ep1 (low/full speed + high speed)
    *fd_in = open(USB_EPIN, O_RDWR);

    if (*fd_in <= 0)
    {
        printf("Unable to open %s (%m)\n", USB_EPIN);
        goto end;
    }

    *(uint32_t*)init_config = 1;
    cp = &init_config[4];

    FETCH(ep_descriptor_in);
    FETCH(ep_descriptor_in);

    send_size = (uint32_t)cp-(uint32_t)init_config;
    ret = write(*fd_in, init_config, send_size);

    if (ret != send_size)
    {
        printf("Write error %d (%m)\n", ret);
        goto end;
    }

    printf("ep1 configured\n");

    // Configure ep2 (low/full speed + high speed)
    *fd_out = open(USB_EPOUT, O_RDWR);

    if (*fd_out <= 0)
    {
        printf("Unable to open %s (%m)\n", USB_EPOUT);
        goto end;
    }

    *(uint32_t*)init_config = 1;
    cp = &init_config[4];

    FETCH(ep_descriptor_out);
    FETCH(ep_descriptor_out);

    send_size = (uint32_t)cp-(uint32_t)init_config;
    ret = write(*fd_out, init_config, send_size);

    if (ret != send_size)
    {
        printf("Write error %d (%m)\n", ret);
        goto end;
    }

    printf("ep2 configured\n");

    ret = 0;

end:
    return ret;
}
Finally, the io_thread() that responds to host requests. Here, I use select, but it seems not to be handled by driver, I/Os are just blocking, but it could be necessary if we want to stop thread.
/*
 * Respond to host requests
 */
static void* io_thread(void* arg)
{
    struct io_thread_args* thread_args = (struct io_thread_args*)arg;
    fd_set read_set, write_set;
    struct timeval timeout;
    int ret, max_read_fd, max_write_fd;
    char buffer[512];

    max_read_fd = max_write_fd = 0;

    if (thread_args->fd_in > max_write_fd) max_write_fd = thread_args->fd_in;
    if (thread_args->fd_out > max_read_fd) max_read_fd  = thread_args->fd_out;

    while (!thread_args->stop)
    {
        FD_ZERO(&read_set);
        FD_SET(thread_args->fd_out, &read_set);
        timeout.tv_sec = 0;
        timeout.tv_usec = 10000; // 10ms

        memset(buffer, 0, sizeof(buffer));
        ret = select(max_read_fd+1, &read_set, NULL, NULL, &timeout);

        // Timeout
        if (ret == 0)
            continue;

        // Error
        if (ret < 0)
            break;

        ret = read (thread_args->fd_out, buffer, sizeof(buffer));

        if (ret > 0)
            printf("Read %d bytes : %s\n", ret, buffer);
        else
            printf("Read error %d(%m)\n", ret);

        FD_ZERO(&write_set);
        FD_SET(thread_args->fd_in, &write_set);

        memset(buffer, 0, sizeof(buffer));
        ret = select(max_write_fd+1, NULL, &write_set, NULL, NULL);

        // Error
        if (ret < 0)
            break;

        strcpy(buffer, "My name is USBond !");

        ret = write (thread_args->fd_in, buffer, strlen(buffer)+1);

        printf("Write status %d (%m)\n", ret);
    }

    close (thread_args->fd_in);
    close (thread_args->fd_out);

    thread_args->fd_in = -1;
    thread_args->fd_out = -1;

    return NULL;
}
4. host side
Host part is very easy to implement. This part can be handled by libusb for a more complete and generic code.
#include <sys/ioctl.h>
#include <sys/types.h>
#include <sys/stat.h>

#include <linux/usbdevice_fs.h>
#include <linux/usb/ch9.h>

#include <fcntl.h>
#include <stdio.h>
#include <unistd.h>
#include <stdint.h>
#include <string.h>

#define USB_DEV "/proc/bus/usb/001/002"

int main()
{
    int fd, ret, err=-1;
    struct usbdevfs_connectinfo connectinfo;
    struct usbdevfs_bulktransfer transfert;
    uint32_t val;
    char buffer[512];

    printf("Build %s @ %s\n", __DATE__, __TIME__);

    fd = open(USB_DEV, O_RDWR);

    if (fd <= 0)
    {
        printf("Unable to open %s (%m)\n", USB_DEV);
        return 1;
    }

    printf("Device opened\n");

    // Optional get information
    ret = ioctl(fd, USBDEVFS_CONNECTINFO, &connectinfo);
    if (ret)
    {
        printf("USBDEVFS_CONNECTINFO error %d (%m)\n", ret);
        goto end;
    }

    printf("devnum %d, slow %d\n",
           connectinfo.devnum, connectinfo.slow);

    // Claim interface 0
    val = 0;
    ret = ioctl(fd, USBDEVFS_CLAIMINTERFACE, &val);
    if (ret)
    {
        printf("USBDEVFS_CLAIMINTERFACE error %d (%m)\n", ret);
        goto end;
    }
    else
        printf("Interface claimed\n");

    // Send data on ep2out
    strcpy(buffer, "What is your name ?");

    transfert.ep = USB_DIR_OUT + 2;
    transfert.len = strlen(buffer)+1;
    transfert.timeout = 200;
    transfert.data = buffer;

    ret = ioctl(fd, USBDEVFS_BULK, &transfert);
    if (ret < 0)
    {
        printf("USBDEVFS_BULK 1 error %d (%m)\n", ret);
        goto end;
    }
    else
        printf("Transfert 1 OK %d\n", ret);

    // Receive data on ep1in
    transfert.ep = USB_DIR_IN + 1;
    transfert.len = sizeof(buffer);
    transfert.timeout = 200;
    transfert.data = buffer;

    ret = ioctl(fd, USBDEVFS_BULK, &transfert);
    if (ret < 0)
    {
        printf("USBDEVFS_BULK 2 error %d (%m)\n", ret);
        goto end;
    }
    else
        printf("Transfert 2 OK %d %s\n", ret, buffer);

    // Release interface 0
    val = 0;
    ret = ioctl(fd, USBDEVFS_RELEASEINTERFACE, &val);
    if (ret)
    {
        printf("USBDEVFS_RELEASEINTERFACE error %d (%m)\n", ret);
        goto end;
    }

    printf("Interface released\n");

    err = 0;

end:
    close(fd);

    return err;
}
To start, we claim an interface. This ioctl fully handled in host side driver (nothing is send to device). After that, a simple send/receive protocol. Finally we release interface. be carreful, USB_DEV path change when the device is disconnected.
5. Conclusion
The full code can be found on my server. This basic example can be extended a lot : isochronous, asynch requests, streams (USB 3). Enjoy !